Experiment 6.2
Frequency Response
Equipment
- Test board
- 1k\(\Omega\) and 100\(\Omega\) resistors
- 0.1 \(\mu F\) capacitor
- LM741 opamp
- Lab computer or laptop
Part A: Measuring Frequency Response
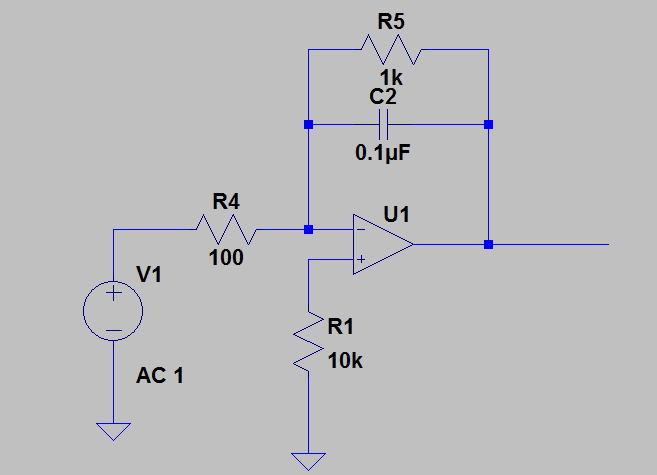
In this part of the lab you will use look at the frequency response of an op amp circuit called an integrator (which does exactly that... integrates the input).
-
Build the following circuit. For the input, connect a 1 Vp-p sinusoidal signal from your VirtualBench function generator.
-
Record the peak-to-peak output voltage values for the following frequencies: 10Hz, 100Hz, 500 Hz, 800 Hz, 1kHz, 1.5kHz, 2kHz, 5kHz, 10kHz, 50kHz.
-
At the same above frequencies, record the phase shift between input and output.
-
In VirtualBench, use your vertical cursors to make this phase measurement: pick a salient feature of your signal (i.e., peak, or zero crossing of signal) and measure the time difference delta-t between when your input and output signal exhibit that salient feature. If you use cursors, the difference between cursor points should appear below the oscilloscope window. Make sure you zoom in each time you increase frequency, to ensure similar accuracy of values. Phase is \((\Delta-t)*2*pi/T\), where \(T\) is the period.
-
Plot Gain(dB) vs. Frequency (Hz) in Matlab.
Tip
\(\text{gain (db) } = 20*log_{10}(V_{out} / V_{in})\)
-
At what frequency does the gain begin to drop?
-
This is called the cutoff frequency, \(f_c\), does it roughly equal \(f_c=1/(2 * \pi * R_5 * C_2)\)?
Part B: Circuit Simulation
The remainder of the lab can be done from a computer (lab computer or personal laptop). We will be using circuit simulation software called LTSpice. Spice stands for (Simulation Program with Integrated Circuit Emphasis).
-
Download LTspice from linear.com there are Windows and Mac versions available. Please note that the instructions below are specifically for Windows.
-
Click on New Schematic and create the same circuit you built on your breadboard shown above.
-
Place components by going to the Edit menu or shortcut buttons.
-
The opamp is found under Edit \(\rightarrow\) Components \(\rightarrow\) [OpAmps] \(\rightarrow\) opamp. The voltage source is found under Edit \(\rightarrow\) Components \(\rightarrow\) voltage. Connect components using Edit \(\rightarrow\) Wire (or the shortcut button F3).
-
Other convenient shortcuts are:
- Ctrl-R for Rotate
- Delete, or F5 for Delete
- F6 for Copy
- F7 for Move
- F8 for Drag
- Esc to exit out of a mode
-
The component opamp is just a symbol of an opamp and in order for Spice to see the model, you need to place a Spice Directive calling the location: Edit \(\rightarrow\) Spice Directive. Then enter
.lib opamp.sub -
Set the voltage source to AC by right-clicking it and selecting Advanced. Set AC amplitude to 1.
-
Enter in \(R\) and \(C\) values by right-clicking these components.
-
Optional label nets (i.e., wires) by right-clicking on nets.
-
Perform an AC analysis. An AC analysis will evaluate the gain (\(V_{out}\)/\(V_{in}\)) and phase over a specified range of frequencies and plot it.
-
Click on the Running Man icon and select AC analysis (or go to Simulate \(\rightarrow\) Run).
-
Use a decade frequency sweep with at least 10 points per decade over the range of 1 Hz to 10 MHz. This will appear as a Spice directive on your schematic as
.ac dec 10 1 10meg -
Click on the \(V_{out}\) node for gain and phase plots to appear. You will notice that the gain is displayed in dB and phase in degrees. The x-axis will be logarithmic, i.e., the step size is 10n, where n is 0,1,2 Each of the steps is called a decade (dec).
-
Take a screenshot of your plots.
-
What is the gain at low frequencies? What is the cutoff frequency? What is the slope of the gain with respect to frequency for high frequencies (express in terms of dB/dec)? Do these values match what you measured on your breadboard?
-
What is the phase for very low frequencies? At 0dB? And for very high frequencies? Can you explain why?