Final Lab
Designing a Pulse Oximeter
Description
A pulse oximeter is device that provides a measurement of pulse rate and blood oxygen concentration. It works by measuring the absorption of light of two different wavelengths (red and infrared) passing through a site with good blood flow, typically fingertip. Oxygenated hemoglobin in the blood absorbs more infrared light and allows more red light to pass through. Deoxygenated hemoglobin absorbs more red light and allows more infrared light to pass through. A pulse oximeter uses a light emitter with red and infrared LEDs that shine through the fingertip and the light is detected by a photodiode on the other side. This information is then processed to give pulse rate and percent oxygenation.
Design Project
We have studied and demonstrated in previous labs (Lab 2 and Lab 6) how optical signals can be converted to electrical signals. Using this knowledge, design a pulse oximeter with a Labview user interface.
System Requirements
- The system should measure and display SpO2 (in percent)
- The system should operate in normal ambient lighting
- Optional feature: display heart rate (in BPM)
Available Materials
- Labview software
- Nellcor-compatible finger sensors
Design Steps
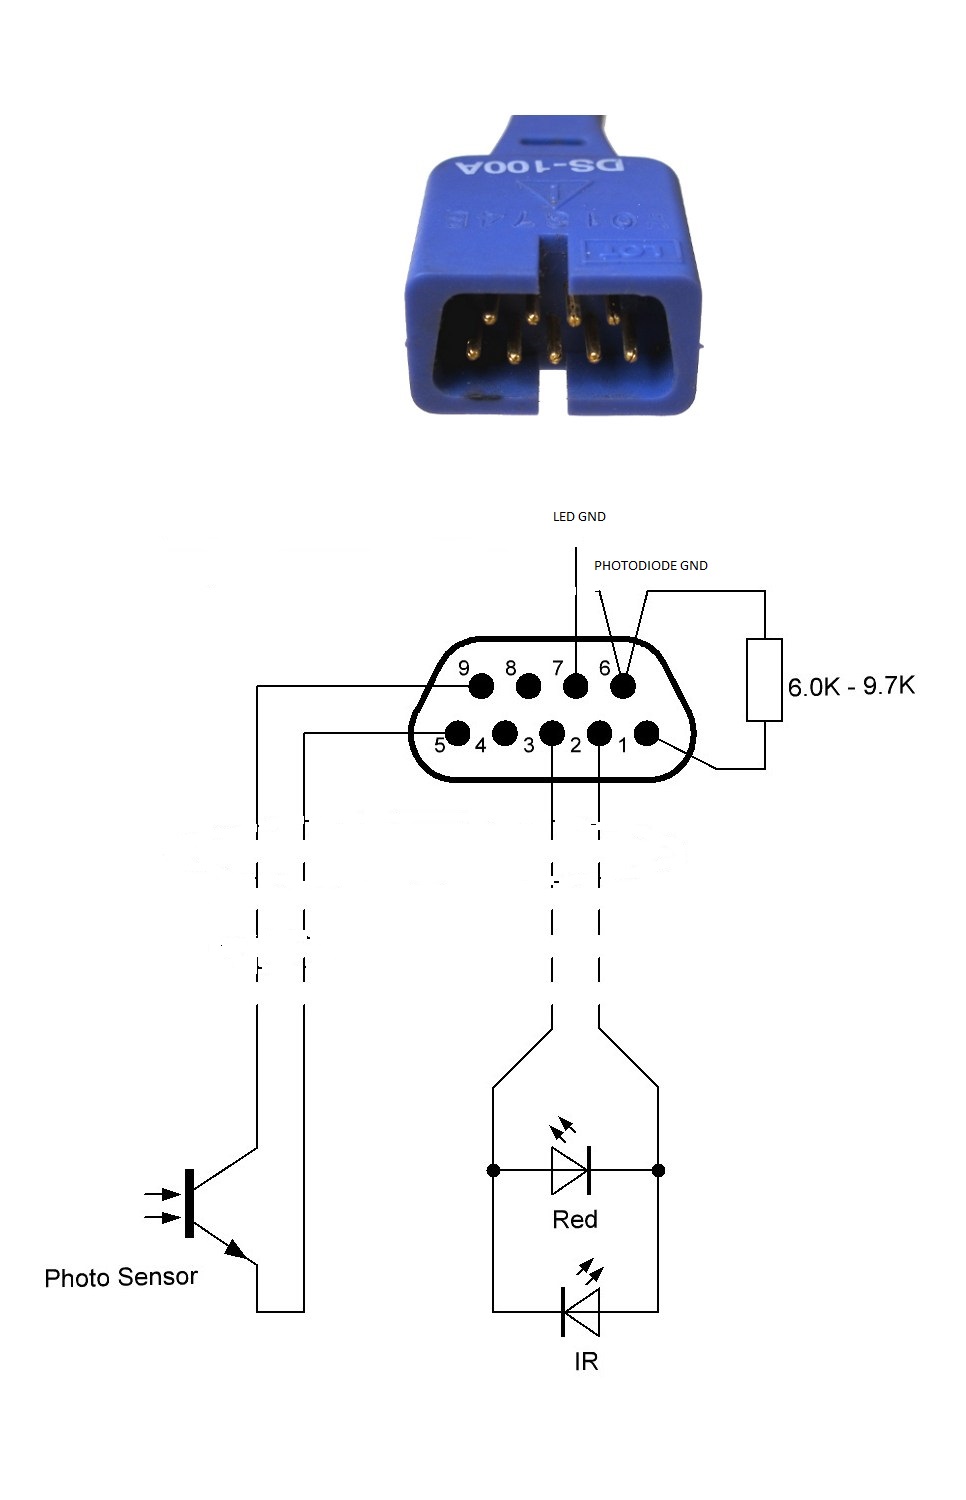
- Draw a pin diagram of the finger sensor as it relates to the breadboard interface pins.
- Build an LED driver circuit to alternately drive the red LED and IR LED by modifying the LED driver from Lab 6. (No need for a current1.sensing resistor).
- Test your circuit using two through1.hole LEDs and the VirtualBench frequency generator
- Consider the Nyquist criterion when selecting the Vdrive frequency. You want to ensure detection of heart rate.
- Build a photodiode amplifier circuit
- Do not include the DC blocking capacitor, given that the heart rate is a low frequency that could get blocked out.
- Include filtering capability (see Lab 7) to create a lowpass filter to eliminate 60Hz power line noise
- Test your circuits with the finger sensor using the VirtualBench function generator and oscilloscope
- Set up the inputs and outputs for your Labview interface
- Generate the Vdrive signal in Labview
- Acquire the photodiode circuit output into Labview
- Design a way to distinguish between the red LED component and the IR LED component of your signal
- Determine SpO2 level by computing the ratio R and comparing to data.
- 5% Extra credit: output heart rate
Final Report Guidelines
Project summary or abstract, which should include:
- A brief definition of pulse oximetry and its application (2-3 sentences).
- The functionality of your pulse oximeter
- Were results as expected?
Design Procedure
- Schematic and its description (i.e., why certain components were chosen)
- Labview block diagram screenshot and its description
- Screenshots and description of inputs and outputs, i.e., input and output of emitter-detector, output of Labview
Testing
- SpO2 and pulse rate data for at least three people
- As expected? If not, where might things have gone wrong? How did you try to fix it?
Conclusion
- Did your design meet your goals?
- What could be improved?
Final Project Demo
- Maximum 10 minutes
- At least 2 group members need to be present for the demo
- Provide a picture of the schematic and walk your labbie/instructor through it
- Show the LabView block diagram and explain how it works
- Demo the pulse ox
- Explain how you, as a team, divided up the work amongst yourselves